MLS® home sales in Newfoundland and Labrador post third best monthly total ever in July, overall inventory remains stable
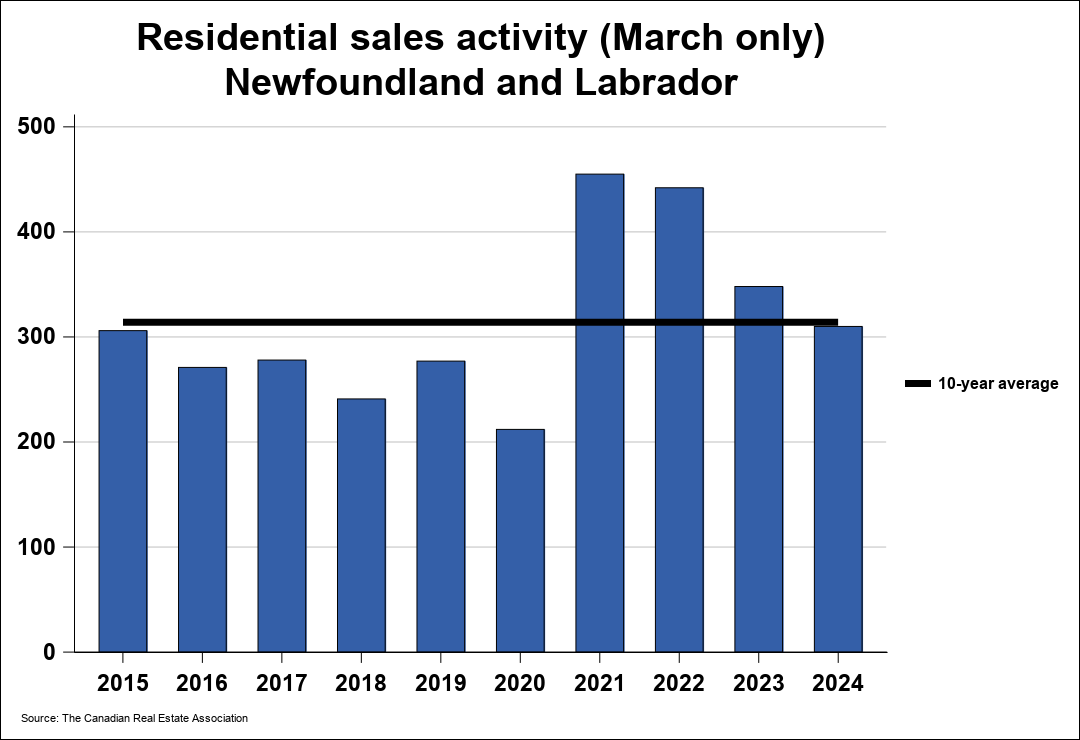
The number of homes sold through the MLS® System of the Newfoundland and Labrador Association of REALTORS® totaled 703 units in July 2022, declining 11.9% from July 2021.
Home sales were 17.9% above the five-year average and 30.8% above the 10-year average for the month of July.
On a year-to-date basis, home sales totaled 3,563 units over the first seven months of the year. This was virtually unchanged from the same period in 2021, moving only 0.1% (five sales).
Residential activity in St. John’s was down by 10.9% on a year-over-year basis in July, while activity in the rest of the province was also down by 12.3%.
Single detached home sales in St. John’s retreated 21.1% from levels recorded in July 2021.
The MLS® Home Price Index (HPI) tracks price trends far more accurately than is possible using average or median price measures. The overall MLS® HPI composite benchmark price was $285,900 in July 2022, an increase of 9.7% compared to July 2021.
The benchmark price for single-family homes was $288,000, a moderate gain of 9.8% on a year-over-year basis in July. By comparison, the benchmark price for townhouse/row units was $272,500, increasing by 5.5% compared to a year earlier, while the benchmark apartment price rose by 10.4% to $221,100, from year-ago levels.
The overall MLS® HPI composite benchmark price for homes in St. John’s was $320,400 in July 2022, up by 8.1% compared to July 2021.
The benchmark price for single-family homes in St. John’s was $331,800, an increase of 8.4% on a year-over-year basis in July. By comparison, the benchmark price for townhouse/row units was $272,500, a moderate gain of 5.5% compared to a year earlier, while the benchmark apartment price was $220,200, increasing by 11.1% from year-ago levels.
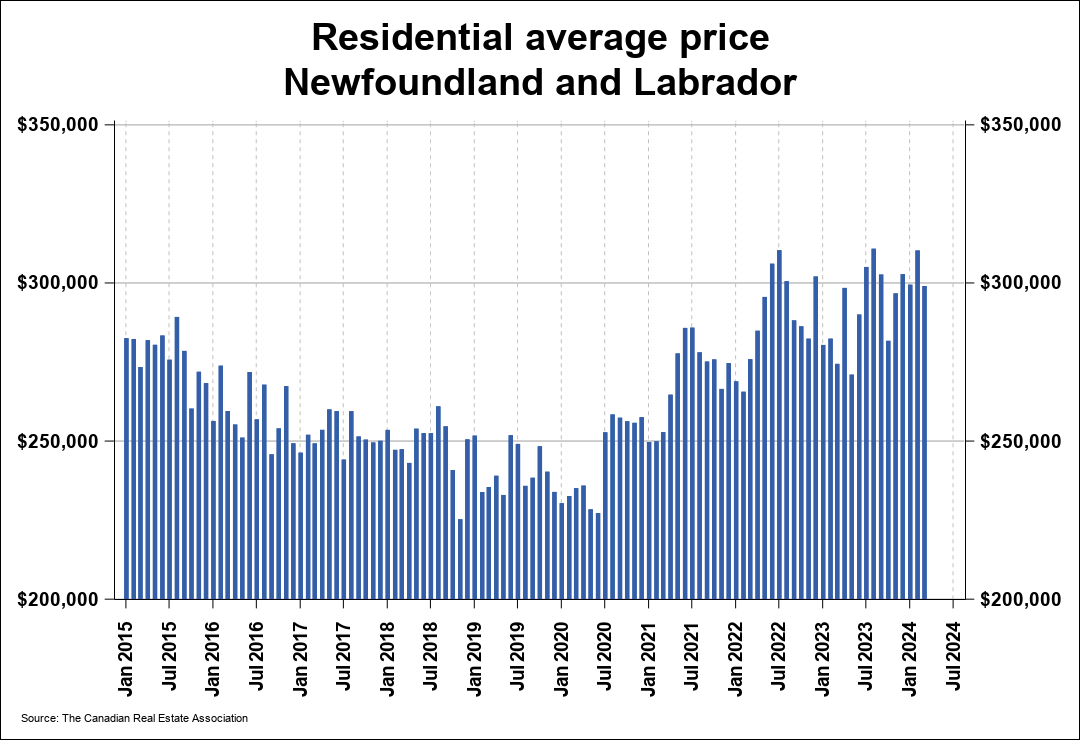
The average price of homes sold in July 2022 was a record $311,093, up by 8.8% from July 2021.
The more comprehensive year-to-date average price was $291,397, an increase of 7% from the first seven months of 2021.
The dollar value of all home sales in July 2022 was $218.7 million, a moderate decrease of 4.2% from the same month in 2021.
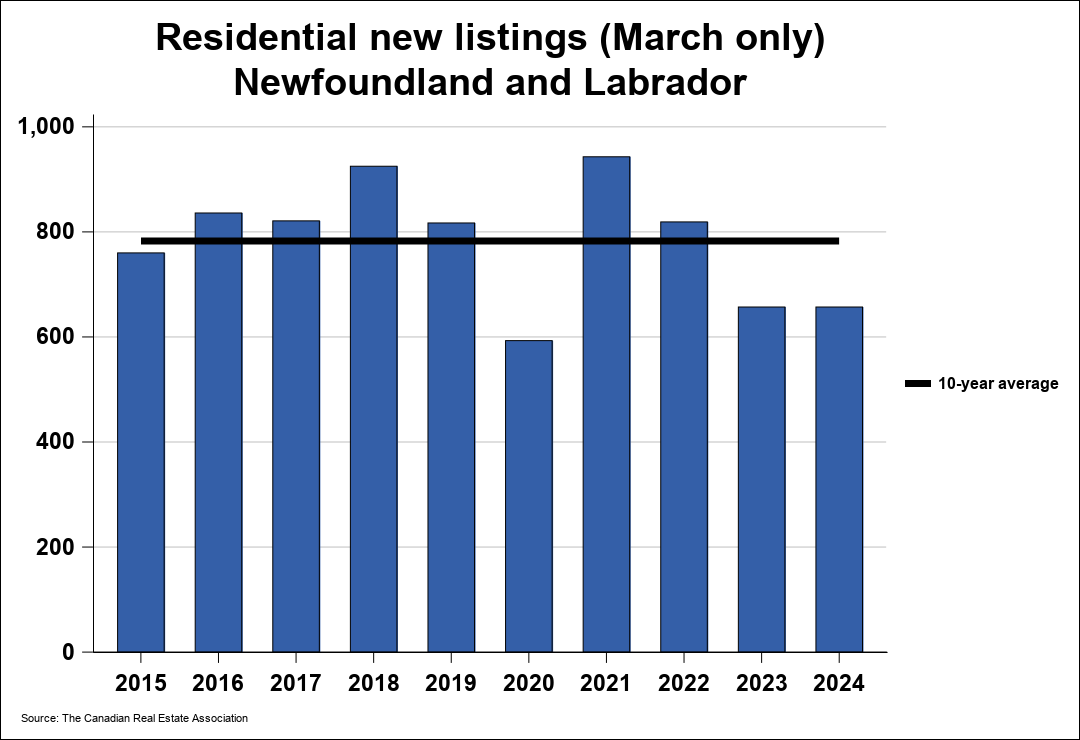
The number of new listings declined by 14.6% from July 2021. There were 953 new residential listings in July 2022. This was the lowest number of new listings added in the month of July in a decade.
New listings were 16.2% below the five-year average and 15.3% below the 10-year average for the month of July.
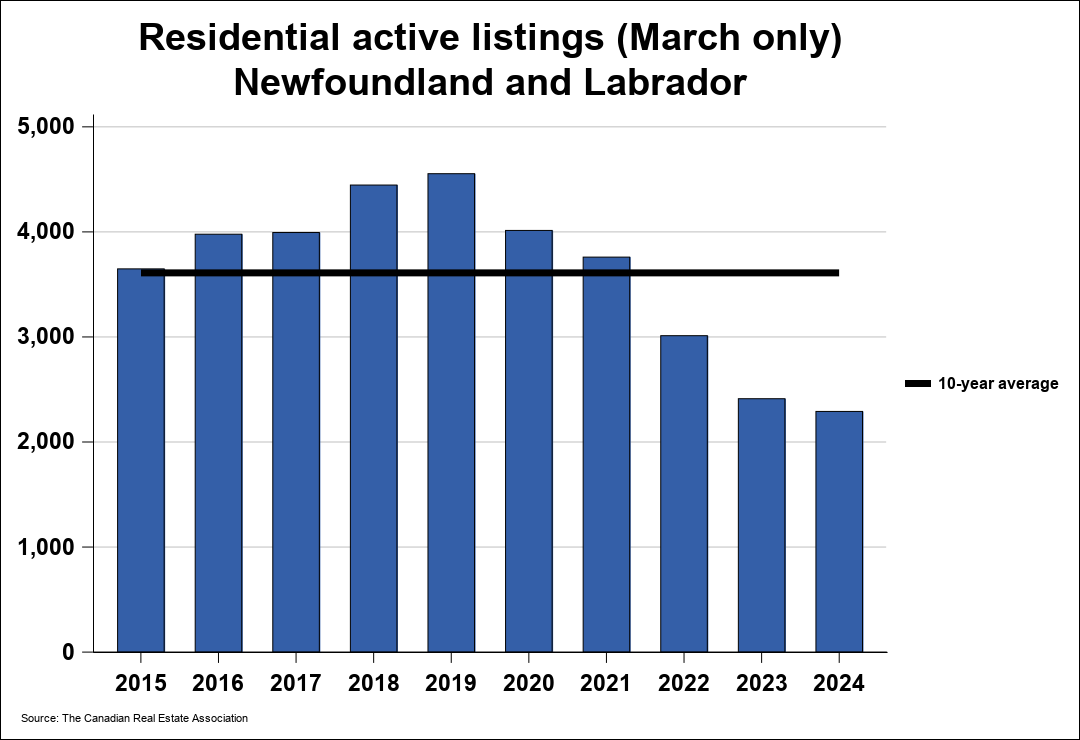
Active residential listings numbered 3,156 units on the market at the end of July, a sharp decrease of 32% from the end of July 2021. Active listings haven’t been this low in the month of July in more than a decade.
Active listings were 36.8% below the five-year average and 36.9% below the 10-year average for the month of July.
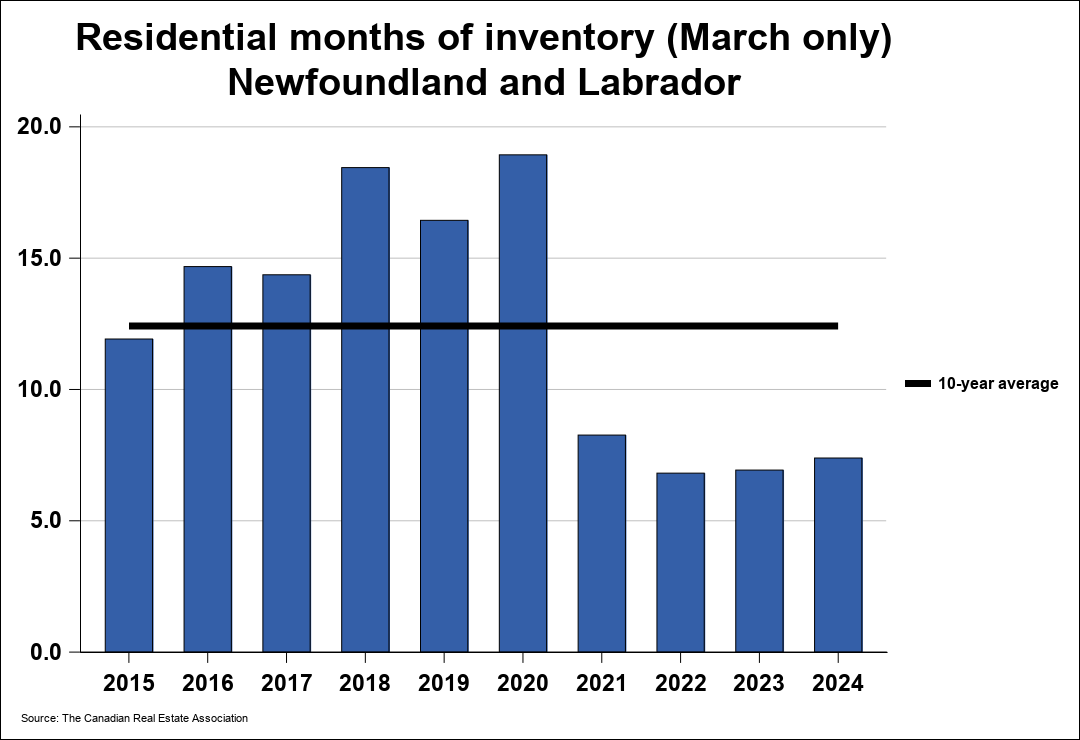
Months of inventory numbered 4.5 at the end of July 2022, down from the 5.8 months recorded at the end of July 2021 and below the long-run average of 9.9 months for this time of year. The number of months of inventory is the number of months it would take to sell current inventories at the current rate of sales activity.
Courtesy: crea.ca
Leave A Comment